Tips and Tricks for Debugging in Eclipse
Breakpoint PropertiesAfter setting a breakpoint you can select the properties of the breakpoint to for example use a condition to restrict when the breakpoint should get toggeled
There are 3 settings that you can tweak.
1. Hit count – Break only when code flow passes over this breakpoint N times.
2. Condition – Break when a specific programmatic condition is reached.
3. Suspend VM Vs Suspend Thread – This is useful when debugging multithreaded application. If you want to suspend only the current thread and not all threads that are running through this code flow, you can use this drop down.
Conditional breakpointsWe can declare conditional breakpoints triggered whenever the value of an expression changes.
Watchpoint
A watchpoint is a breakpoint at which is stop whenever a field read or changed. You can set a watchpoint through a double-click on the left side before the field declaration. Via the properties of the watchpoint you can define if the breakpoint should be hit during read access (Field Access) or during write access (Field Modification).
Exception Breakpoint
The application is stopped if the specified exception is thrown.
Method Breakpoint
A method breakpoint is defined via double-click in the left border of the editor and the method head. You can define if you want to stop the program during method entry of after leaving the method.
Class breakpoint
A Class Load Breakpoint will stop when the class is loaded. Right-click on a class in the Outline View and choose "Toggle Class Load Breakpoint"
Toggling class breakpoints on the class without the source code
Just go to the main menu and choose Run->Add Class Load Breakpoint…
Debug details formatter
Eclipse allows you to write your own formatter for displaying the content you are interested in. You can do it in the Eclipse preferences under Java->Debug->Detail Formatters.
Or in the Variables view, right click on the variable, then select "New Detail Format'.
This is also very useful for the standard classes such as map, list.
Logical Structure in Variables view
The logical structure is very handy for examining things like maps and other java collections classes, instead of showing the full detail of all the internal variables the view will only show the "logical" pieces.
Expression Evaluation
1. Inspect an expression
2. Use the Display View,
Write your expressions to evaluate and execute them by right clicking and selecting "Display" from the context menu.
Step Filtering
It filters out the classes that we don’t want to step into.
To specify which classes to filter out when "Step with Filters" is used, the preferences must be set.
Window > Preferences -> Java > Debug > Step Filtering and choose the classes/packages to be filtered out. When you step through the code, ensure that the "Use Step Filters" toggle button in Debug view is on.
Displaying all references of an object
If you want to display references of the specific object, right click on the object in the Variables view and choose All References. The popup window will appear with all references. If you want to see all references of all available objects go to the menu in the Variables view and choose Java->Show References.
Change variable values dynamically
You can use the Variables view to change the value of a variable dynamically.
Drop to frame
Eclipse allows you to select any level (frame) in the call stack during debugging and set the JVM to restart to that point.
This allows you to rerun a part of your program.
It also allows you to retrace your path after making a minor code change. The code flow goes back to the line of code you have dropped to and executes once again.
Hotswap Bug Fixing: On-the-fly code fixing
If you are running Java Virtual Machine (JVM) V1.4 or higher, Eclipse supports a feature called Hotswap Bug Fixing. It allows the changing of source code during a debugger session,
This is because JPDA implements the ability to substitute modified code in a running application.
Debug Java applications remotely with Eclipse
Run > Debug Configurations, then select the connector from the dropdown list. Two connectors are provided: Socket Attach, and Socket Listen
For the socket-listening connector, the Eclipse VM will be the host to be connected by the remote Java application.
For the socket-attaching connector, the target VM will be the host. There is no difference for application debugging between the two connectors — the user may choose.
A good rule of thumb is to use the faster, more powerful computer as the VM debug host because of the computational resources required.
Remote VM acts as debug server
Start remote java application as a debug server first:
java -agentlib:jdwp=transport=dt_socket,server=y,address="remote_server_public_ip:8000" DebugMe
java -Xdebug -Xrunjdwp:transport=dt_socket,server=y,address="remote_server_public_ip:8000" DebugMe(Prior to Java1.4)
Configure local eclipse:
Connection Type: Socket Attach
Remote Target VM acts as debug client
In this case, the remote Java application acts as a debug client, and the eclipse debugger front end acts as a debug server.
Eclipse uses the socket listen-mode connection type for listening. The debug front end must be started in advance to listen on a specific port.
Configure local eclipse:
Connection Type: Socket Listen
Then start remote java application as a debug client:
java -agentlib:jdwp=transport=dt_socket,suspend=y,address="eclipse_machine_ip:8000" DebugMe
java -Xdebug -Xrunjdwp:transport=dt_socket,suspend=y,address="eclipse_machine_ip:8000" DebugMe(Prior to Java1.4)
You need to make sure the debug options are all enabled in in Window > Preferences > Java > Compiler.
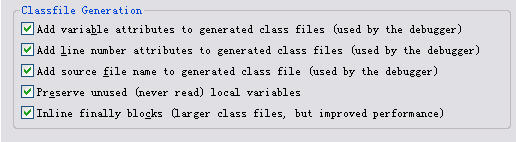
Mae sure the jars in your remote server are build with these debug options enabled.
Remote Debugging Tomcat & JBoss Apps with Eclipse
Resources:
Java Debugging with Eclipse - Tutorial
Tips and Tricks for Debugging in Eclipse
5 Tips for Debugging Java Code in Eclipse
Eclipse tips and tricks – Part 2
Debug Java applications remotely with Eclipse
Remote debug with Java and Eclipse